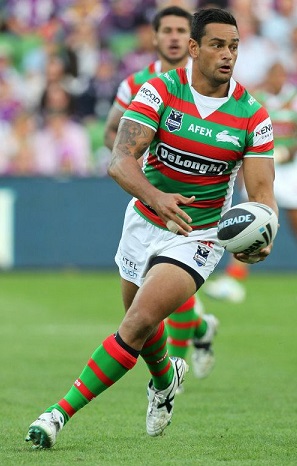
John is a local South Sydney junior who has played the most number of first grade and all grades matches for South Sydney.
Representative Qualification
NSW City
Fiji

Contracted Until
End of 2019

Date of Birth
5th November 1984

South Sydney Junior Club
Kensington United
La Perouse
Coogee Wombats

Previous Clubs
None
Playing Career at South Sydney (2002-19)
South Sydney First Grade Debut
2004 Rd17 v Brisbane (19y 242d)

First Grade
                           Premiership                               WCC
         M   S   I   T   G/A   FG  Pts :   M   S   I   T   G/A   FG  Pts
2004    10  10   -   2   -      -    8
2005    19  19   -   5   7/10   1   35
2006    21  21   -   7   -/1    -   28
2007    16  13  (3)  3   -      -   12
2008    24  24   -   6   -      -   24
2009    22  22   -   5   -      -   20
2010    20  20   -   4   -      -   16
2011    23  23   -   3   -      -   12
2012    27  27   -   4   -      -   16
2013    25  25   -   7   -      -   28
2014    22  22   -   1   -      -    4
2015    17  17   -   2   -      -    8 :   1   1   -   -   -      -    -
2016    12  12   -   1   -      -    4
2017    24  24   -   5   -      -   20
2018    27  27   -   4   -      -   16
2019    27  25  (2)  2   -      -    8

TOTAL  336 331  (5) 61   7/11   1  259 :   1   1   -   -   -      -    -

SS Cup   1   1   -   -   -      -    -
SS FG  337 332  (5) 61   7/11   1  259

Lower Grades
                         Reserve Grade :               Third Grade(U20s)
Year     M   S   I   T   G/A   FG  Pts :   M   S   I   T   G/A   FG  Pts
2002     -   -   -   -   -      -    - :  12  11  (1)  5   -      -   20
2003     5   3  (2)  1   -      -    4 :               2   -      -    8
2004     5   5   -   2   3      -   14 :   6   6   -   3   4      -   20
2005     -   -   -   -   -      -    - :
2006     -   -   -   -   -      -    - :
2007     -   -   -   -   -      -    - :
2008     -   -   -   -   -      -    - :
2009     -   -   -   -   -      -    - :
2010     -   -   -   -   -      -    - :
2011     -   -   -   -   -      -    - :
2012     -   -   -   -   -      -    - :
2013     -   -   -   -   -      -    - :
2014     -   -   -   -   -      -    - :
2015     -   -   -   -   -      -    - :
2016     -   -   -   -   -      -    - :
2017     -   -   -   -   -      -    - :
2018     -   -   -   -   -      -    - :
2019     -   -   -   -   -      -    - :

TOTAL   10   8  (2)  3   3      -   18 :  18  17  (1)  8   4      -   40 :

South Sydney Senior(FG/RG/3G) Grade Career
                           Premiership :                             Cup :                     All Matches
         M   S   I   T   G/A   FG  Pts :   M   S   I   T   G/A   FG  Pts :   M   S   I   T   G/A   FG  Pts
CAREER 364 356  (8) 72  14      1  317 :   1   1   -   -   -      -    - : 365 356  (6) 72  14      1  317

Short Form
                                    7s :                              9s
         M   S   I   T   G/A   FG  Pts :   M   S   I   T   G/A   FG  Pts
2004     -   -   -   -   -      -    -
2014                                   :   4   4   -   -   -      -    -
2015                                   :   -   -   -   -   -      -    -
2016                                   :   3   3   -   -   -      -    -
2017                                   :   -   -   -   -   -      -    -

TOTAL    -   -   -   -   -      -    - :   7   7   -   -   -      -    -

SS SF    7   7   -   -   -      -    -
Match Statistics at South Sydney
2012 FG Statistics
Min Tac Pe MT LB HU DR m Er OL K TA T G/A FG
Rd01 5/8 Syd Rstrs 66 11 - 4 1 18 1 146 1 - 5 - 1 - -
Rd02 5/8 Melbourne 80 21 1 2 - 8 1 65 - 3 6 - - - -
Rd03 5/8 Penrith 80 18 1 - 2 6 - 55 - 1 5 1 - - -
Rd04 5/8 Brisbane 80 20 - 2 - 3 - 19 - 1 9 - - - -
Rd05 5/8 Wests-Tig 82 21 - 2 1 10 1 82 2 1 2 - - - -
Rd06 5/8 Canterbury 80 23 - 2 - 15 - 117 - 2 6 - - - -
Rd07 5/8 Warriors 80 26 - 3 - 9 - 67 - 2 2 - - - -
Rd08 5/8 Nth Qld 80 34 1 4 - 10 1 75 1 - 4 - - - -
Rd09 5/8 Cronulla 80 19 1 6 - 11 1 83 - 1 6 - - - -
Rd11 5/8 St Geo-Ill 82 20 - 1 - 13 - 90 1 - 6 - - - -
Rd12 5/8 Canberra 80 16 - 3 - 13 1 86 1 1 5 - - - -
Rd13 5/8 Canterbury 80 15 - 2 - 11 - 73 - 1 3 1 - - -
Rd15 5/8 Parramatta 80 24 - - - 7 1 61 - - 13 - - - -
Rd16 5/8 Brisbane 80 28 - 2 - 10 - 64 1 1 6 1 - - -
Rd17 5/8 Penrith 80 25 - 3 - 24 2 158 1 2 8 1 - - -
Rd18 5/8 Newcastle 80 22 - 2 - 16 - 111 - 1 8 - 1 - -
Rd19 5/8 Syd Rstrs 80 17 - 3 - 14 - 91 - 1 5 - - - -
Rd20 5/8 St Geo-Ill 80 14 - 1 2 8 - 117 - - 5 3 1 - -
Rd21 5/8 Wests-Tig 80 20 - - 2 17 - 199 - 1 6 1 - - -
Rd22 5/8 Gold Coast 80 11 - 3 - 17 2 157 - 2 9 1 - - -
Rd23 5/8 Manly 80 16 - 2 - 12 1 84 - - 4 - - - -
Rd24 5/8 Cronulla 80 23 - 2 - 15 1 140 - - 4 - - - -
Rd25 5/8 Parramatta 80 27 2 1 - 18 1 154 - - 6 1 - - -
Rd26 5/8 Newcastle 80 19 - 3 1 9 1 93 - - 4 1 1 - -
MPSF 5/8 Melbourne 80 14 - 1 - 12 1 109 - 4 4 - - - -
MSF 5/8 Canberra 80 16 - - 2 8 3 114 1 2 4 1 - - -
mF 5/8 Canterbury 80 19 - 1 - 13 3 139 1 1 12 - - - -
2012 TOTALS 2150 539 6 55 11 327 22 2749 10 28 157 12 4 - -
2012 FG Average Minutes - 79.6
2012 FG Average Tackles (80 min) - 20.1
2012 FG Average Runs (80 min) - 12.2
2012 FG Average Meters per run - 8.4m
2012 FG Tackling Ability - 90.7%
2013 FG Statistics
Min Tac Pe MT LB HU DR m Er OL K TA T G/A FG
Rd01 5/8 Syd Rstrs 80 23 - 2 - 13 - 111 - 3 4 - - - -
Rd02 5/8 Cronulla 80 27 1 - - 13 - 115 1 2 4 - - - -
Rd03 5/8 Penrith 80 11 - 1 1 11 1 90 1 1 6 1 1 - -
Rd04 5/8 Canterbury 80 28 - 2 - 11 1 106 - 1 6 - - - -
Rd05 5/8 Warriors 80 22 - 5 - 9 2 83 - 1 5 - - - -
Rd06 5/8 Melbourne 80 19 - 1 - 11 - 91 - 1 6 - - - -
Rd07 5/8 Manly 80 11 1 1 1 14 1 125 - 1 6 - 1 - -
Rd08 5/8 Brisbane 80 18 1 - 1 12 1 107 3 1 5 1 1 - -
Rd09 5/8 Nth Qld 77 30 - 1 1 8 - 101 - - 6 2 - - -
Rd10 5/8 Wests-Tig 80 10 - 2 2 9 - 89 - 1 11 2 - - -
Rd11 5/8 Cronulla 68 20 - 3 1 7 - 93 - 1 3 - - - -
Rd12 5/8 Newcastle 80 18 - 2 1 13 3 126 - 1 3 - 1 - -
Rd14 5/8 Gold Coast 80 16 1 1 - 15 2 120 - 2 1 - - - -
Rd15 5/8 Parramatta 80 18 - 1 1 17 - 132 - 2 7 - 1 - -
Rd16 5/8 Canberra 80 23 - 1 - 9 1 68 1 - 9 - - - -
Rd17 5/8 Warriors 80 30 - 3 - 8 - 70 1 1 10 1 1 - -
Rd19 5/8 St Geo-Ill 83 19 - 3 - 15 - 157 - - 6 2 - - -
Rd20 5/8 Gold Coast 80 20 - - - 10 - 69 - - 12 - - - -
Rd21 5/8 Nth Qld 36 7 - 1 - 4 - 32 - - 2 - - - -
Rd23 5/8 Manly 80 17 - 2 - 13 - 92 - 1 5 - - - -
Rd24 5/8 Canterbury 80 15 - 4 - 14 1 122 1 - 2 1 - - -
Rd25 5/8 Wests-Tig 78 16 - 4 - 12 1 113 - - 5 - - - -
Rd26 5/8 Syd Rstrs 80 22 - 2 - 14 - 134 - 2 2 - - - -
MPSF 5/8 Melbourne 80 18 - 1 - 6 1 55 - 1 5 - - - -
mF 5/8 Manly 80 24 - 1 1 10 2 71 - 1 5 - 1 - -
2013 TOTALS 1942 482 4 44 10 278 17 2472 8 24 136 10 7 - -
2013 FG Average Minutes - 77.7
2013 FG Average Tackles (80 min) - 19.9
2013 FG Average Runs (80 min) - 11.5
2013 FG Average Meters per run - 8.9m
2013 FG Tackling Ability - 91.6%
2014 FG Statistics
Min Tac Pe MT LB HU DR m Er OL K TA T G/A FG
Rd01 Lock Syd Rstrs 60 25 1 - - 14 - 76 2 1 1 1 - - -
Rd02 Lock Manly 53 25 - 1 - 9 - 59 - 2 3 - - - -
Rd03 5/8 Wests-Tig 80 22 1 1 - 11 1 89 2 2 2 1 - - -
Rd04 Lock Canberra 57 28 - - - 7 1 52 2 1 2 - - - -
Rd05 5/8 St Geo-Ill 80 22 - 3 - 8 - 68 1 1 7 1 - - -
Rd06 5/8 Penrith 80 16 1 - - 8 - 61 - 1 7 - - - -
Rd07 5/8 Canterbury 80 13 - 4 1 12 - 123 - 3 8 1 1 - -
Rd08 5/8 Brisbane 80 23 - 2 - 8 - 71 - - 4 - - - -
Rd09 5/8 Gold Coast 80 20 - - - 9 - 81 2 3 5 - - - -
Rd10 5/8 Melbourne 80 17 1 4 - 12 1 122 - 2 3 1 - - -
Rd11 5/8 Cronulla 80 26 - - - 8 - 67 - 1 6 - - - -
Rd12 5/8 St Geo-Ill 80 29 - - - 9 1 80 2 1 4 1 - - -
Rd13 5/8 Warriors 80 12 - 3 1 8 1 59 1 - 1 1 - - -
Rd14 5/8 West-Tig 80 18 1 1 - 5 - 56 - - 3 2 - - -
Rd16 5/8 Nth Qld 80 16 - 3 - 8 - 64 - - 6 1 - - -
Rd17 SRow Gold Coast 80 30 - 1 - 11 1 94 - - 1 - - - -
Rd19 5/8 Parramatta 80 22 - 1 - 7 1 50 - 1 5 - - - -
Rd20 5/8 Canberra 8 - - - - - - - - - - - - - -
Rd26 5/8 Syd Rstrs 80 20 - 4 - 5 - 25 - 3 8 - - - -
MPSF SRow Manly 66 27 - - 1 9 - 84 - 3 1 - - - -
mF SRow Syd Rstrs 61 26 - 1 - 7 - 59 1 1 - 1 - - -
GF SRow Canterbury 60 19 - - - 10 - 88 - - 2 1 - - -
2014 TOTALS 1565 456 5 29 3 185 7 1528 13 26 79 12 1 - -
2014 FG Average Minutes - 71.1
2014 FG Average Tackles (80 min) - 23.3
2014 FG Average Runs (80 min) - 9.5
2014 FG Average Meters per run - 8.3m
2014 FG Tackling Ability - 94.0%
2015 First Grade Statistics : Lower Grade Statistics
Min Tac Pe MT LB HU DR m Er OL K TA T G FG : Min Tac Pe MT LB HU DR m Er OL K TA T G FG
WCC SRow St Helens 66 21 - - - 9 - 60 - - 1 1 - - - :
Rd01 SRow Brisbane 69 24 - 1 1 8 1 42 1 - 2 - 1 - - :
Rd02 SRow Syd Rstrs 80 32 - 2 - 8 - 55 1 1 1 - - - - :
Rd09 SRow St Geo-Ill 17 10 - - - 2 - 26 - - - - - - - :
Rd10 5/8 Melbourne 80 25 - 1 - 4 - 38 - - 7 - - - - :
Rd11 5/8 Parramatta 80 21 - 1 - 10 - 93 - 1 10 1 - - - (c) :
Rd12 5/8 Gold Coast 80 9 - 1 1 8 - 72 - 2 7 2 - - - :
Rd13 5/8 Warriors 80 23 - - - 8 1 71 1 2 10 - - - - :
Rd14 SRow Wests-Tig 80 42 - 2 - 11 - 69 1 1 3 - - - - (c) :
Rd16 SRow Manly 80 20 - - 1 10 - 111 1 1 5 1 - - - :
Rd17 SRow Penrith 68 31 - 1 - 8 - 56 - 1 - - - - - (c) :
Rd19 SRow St Geo-Ill 80 29 1 1 1 8 1 92 - - 2 - - - - :
Rd20 SRow Newcastle 67 23 - 1 - 13 - 100 - 2 - 1 - - - :
Rd21 SRow Penrith 77 35 - 4 1 11 - 80 - - 1 - 1 - - :
Rd22 SRow Manly 80 35 - - - 9 - 72 - - - - - - - :
Rd23 SRow Nth Qld 23 12 - - - 4 - 20 - - - - - - - :
Rd24 5/8 Canterbury 80 18 - 3 - 7 - 57 - 2 2 1 - - - :
Rd25 SRow Brisbane 50 16 - 1 - 9 - 93 1 1 - - - - - (c) :
2015 TOTALS 1237 426 1 19 5 147 3 1207 6 14 51 7 2 - - :
2015 FG Average Minutes - 68.7
2015 FG Average Tackles (80 min) - 27.6
2015 FG Average Runs (80 min) - 9.5
2015 FG Average Meters per run - 8.2m
2015 FG Tackling Ability - 95.7%
2016 First Grade Statistics : Lower Grade Statistics
Min Tac Pe MT LB HU DR m Er OL K TA T G FG : Min Tac Pe MT LB HU DR m Er OL K TA T G FG
Rd01 SRow Syd Rstrs 78 27 - 6 - 16 - 103 - 2 1 - - - - :
Rd15 SRow Parramatta 74 22 1 1 - 12 - 97 - - 4 - - - - (c) :
Rd16 SRow Penrith 80 27 - - - 11 - 103 - - 5 1 - - - :
Rd17 SRow Nth Qld 80 50 - 1 - 9 1 60 - 2 2 - - - - :
Rd19 5/8 Brisbane 80 31 - 2 - 7 - 55 - 1 6 - - - - :
Rd20 SRow Manly 80 40 2 - - 16 - 128 - 3 3 - - - - :
Rd21 SRow Canberra 71 24 - 3 1 7 - 76 1 1 3 - 1 - - :
Rd22 SRow Melbourne 85 28 - - - 13 - 132 - 1 1 - - - - :
Rd23 SRow Warriors 80 18 - 2 - 8 - 70 - 1 2 - - - - :
Rd24 SRow Cronulla 80 27 - - - 10 1 107 - 1 3 - - - - :
Rd25 SRow Newcastle 74 24 - 2 - 11 - 84 1 - - - - - - :
Rd26 SRow Canterbury 69 21 - 1 - 13 - 99 - 1 1 1 - - - :
2016 TOTALS 931 339 3 18 1 133 2 1114 2 13 31 2 1 - - :
2016 FG Average Minutes - 77.6
2016 FG Average Tackles (80 min) - 29.1
2016 FG Average Runs (80 min) - 11.4
2016 FG Average Meters per run - 8.4m
2016 FG Tackling Ability - 95.0%
2017 First Grade Statistics : Lower Grade Statistics
Min Tac Pe MT LB HU DR m Er OL K TA T G FG : Min Tac Pe MT LB HU DR m Er OL K TA T G FG
Rd01 SRow Wests-Tig 80 36 - 2 - 7 - 60 - 2 - 1 - - - :
Rd02 SRow Manly 76 25 1 1 1 13 - 127 - - - - 1 - - :
Rd03 SRow Newcastle 72 23 - 3 1 8 - 74 - - 3 - 1 - - :
Rd04 SRow Syd Rstrs 80 30 - 1 - 9 - 78 1 - - - - - - :
Rd05 SRow Nth Qld 76 28 - 1 - 9 - 88 2 - - - - - - :
Rd06 SRow Penrith 80 35 - - 1 16 - 146 - - - 1 - - - :
Rd07 SRow Canterbury 71 24 2 1 - 9 - 66 - 1 - - - - - :
Rd08 5/8 Brisbane 80 28 - 1 1 14 - 130 1 - 1 - - - - :
Rd09 SRow Manly 62 22 1 1 - 7 - 68 - - 1 - - - - :
Rd10 5/8 Wests-Tig 80 16 - 1 - 13 - 97 - 2 2 - - - - :
Rd11 5/8 Melbourne 80 9 1 1 1 16 - 88 2 1 6 - 1 - - :
Rd12 5/8 Parramatta 80 17 - 1 - 6 - 50 - 1 2 - - - - :
Rd14 5/8 Brisbane 80 21 - 1 - 11 1 66 1 1 3 1 - - - :
Rd15 5/8 Gold Coast 80 17 1 - 1 10 - 119 - - - 1 - - - (c) :
Rd17 5/8 Penrith 80 12 - 3 - 12 - 72 - 1 3 - - - - :
Rd18 5/8 Syd Rstrs 80 15 - 1 - 10 - 62 - 1 5 - - - - :
Rd19 5/8 Nth Qld 80 18 - 1 - 10 - 50 1 2 1 - - - - :
Rd20 5/8 Cronulla 80 10 1 1 1 12 - 88 - 1 - - 1 - - :
Rd21 SRow Canberra 80 32 - 3 - 9 - 74 1 - 1 - - - - :
Rd22 SRow St Geo-Ill 56 25 - 1 1 8 1 78 - - - - 1 - - :
Rd23 SRow Canterbury 69 18 1 - - 10 - 97 - 1 - - - - - :
Rd24 SRow Warriors 68 23 - 1 - 11 - 99 - 1 - - - - - (c) :
Rd25 5/8 Melbourne 80 22 - 4 - 7 - 41 - - 5 - - - - :
Rd26 SRow Parramatta 80 25 - - 1 14 - 123 2 - 1 - - - - (c) :
2017 TOTALS 1830 531 8 30 9 251 2 2041 11 15 34 4 5 - - :
2017 FG Average Minutes - 76.3
2017 FG Average Tackles (80 min) - 23.2
2017 FG Average Runs (80 min) - 11.0
2017 FG Average Meters per run - 8.1m
2017 FG Tackling Ability - 94.7%
2018 First Grade Statistics : Lower Grade Statistics
Min Tac Pe MT LB HU DR m Er OL K TA T G FG : Min Tac Pe MT LB HU DR m Er OL K TA T G FG
ChSh SRow #11 St Geo-Ill W 62 21 1 1 1 7 - 75 1 1 - 1 - - - :
Rd01 SRow #11 Warriors L 80 37 1 4 - 8 - 91 - - - - - - - :
Rd02 SRow #11 Penrith L 80 33 - - - 9 1 82 - 1 - - - - - :
Rd03 SRow #11 Manly W 53 20 - - - 11 - 83 - - - - - - - :
Rd04 SRow #11 Canterbury W 73 28 - 1 - 14 - 128 - - - 1 - - - :
Rd05 SRow #11 St Geo-Ill L 72 24 - - - 11 - 91 2 - - - - - - :
Rd06 SRow #11 Syd Rstrs W 80 24 - 2 1 17 1 175 - 1 - - 1 - - :
Rd07 SRow #11 Canberra W 68 15 1 1 - 9 - 98 1 2 - - - - - :
Rd08 SRow #11 Brisbane L 80 29 - 2 1 11 - 76 - 1 1 - 1 - - :
Rd09 SRow #11 Newcastle W 80 22 - 4 - 13 1 95 1 - - - - - - :
Rd10 SRow #11 St Geo-Ill W 68 28 1 2 - 12 - 119 - - 1 1 - - - :
Rd11 SRow #11 Nth Qld W 80 26 - - - 8 - 76 1 2 1 - - - - :
Rd12 SRow #11 Warriors W 80 31 1 - 1 11 - 122 - 1 2 - 1 - - :
Rd13 SRow #11 Cronulla W 80 18 - 3 1 14 - 150 - - 1 1 - - - :
Rd14 SRow #11 Gold Coast W 80 33 - - - 13 - 118 - - - - - - - :
Rd15 SRow #11 Parramatta W 80 26 - 1 - 10 - 82 1 1 - - - - - :
Rd16 SRow #11 Nth Qld W 80 26 - 1 - 16 - 131 - 2 - - - - - :
Rd18 SRow #11 Canterbury W 80 25 1 2 - 14 - 107 - 1 1 - - - - :
Rd19 SRow #11 Wests-Tig L 80 24 - 2 - 17 3 155 3 - - - - - - :
Rd20 SRow #11 Parramatta W 80 18 - 2 - 17 - 149 - 1 - - - - - :
Rd21 SRow #11 Melbourne W 80 19 - 2 - 15 1 119 - - - - - - - :
Rd22 SRow #11 Syd Rstrs L 80 30 3 - - 15 - 138 - 2 - - - - - :
Rd23 SRow #11 Brisbane L 70 20 - 3 - 9 - 74 - - - - - - - :
Rd24 SRow #11 Canberra L 80 22 - 2 - 11 - 123 - 2 - - - - - :
Rd25 SRow #11 Wests-Tig W 80 20 1 1 2 16 - 173 - 2 - 2 1 - - :
MPSF SRow #11 Melbourne L 80 22 - 4 - 16 - 154 1 1 - - - - - :
MSF SRow #11 St Geo-Ill W 76 23 - 5 - 17 1 134 1 1 - - - - - :
MF SRow #11 Syd Rstrs L 80 19 - 2 1 13 - 116 - 2 - - - - - :
2018 TOTALS 2080 662 9 46 7 347 8 3159 11 23 7 5 4 - - :
2018 FG Average Minutes - 77.0
2018 FG Average Tackles (80 min) - 25.5
2018 FG Average Runs (80 min) - 13.3
2018 FG Average Meters per run - 9.1m
2018 FG Tackling Ability - 93.5%
2019 First Grade Statistics : Lower Grade Statistics
Min Tac Pe MT LB HU DR m Er OL K TA T G FG : Min Tac Pe MT LB HU DR m Er OL K TA T G FG
ChSh SRow #11 St Geo-Ill W 41 16 - - - 7 - 56 - - - 1 - - - :
Rd01 SRow #11 Syd Rstrs W 76 17 - 2 - 15 - 129 - 2 - 1 - - - :
Rd02 SRow #11 St Geo-Ill W 26 10 1 1 - 2 - 25 1 - - - - - - :
Rd03 SRow #11 Gold Coast W 62 20 - 1 - 12 - 101 - - - - - - - :
Rd04 SRow #11 Manly L 49 16 - 1 - 7 - 54 1 1 1 - - - - :
Rd05 SRow #11 Warriors W 61 19 - - - 12 - 118 2 1 - - - - - :
Rd06 SRow #11 Canterbury W 63 19 - 1 - 13 - 139 - - - - - - - :
Rd07 SRow #11 Penrith W 58 22 1 1 - 10 - 100 - - - - - - - :
Rd08 SRow #11 Brisbane W 59 17 - 1 1 14 - 125 - - 2 - 1 - - :
Rd09 SRow #11 Nth Qld W 54 15 - 2 - 10 - 100 - 2 - - - - - :
Rd10 SRow #11 Canberra W 65 22 - 1 - 11 - 111 - - 1 - - - - :
Rd11 SRow #11 Wests-Tig W 80 25 1 2 - 12 - 79 - - - - - - - :
Rd12 SRow #11 Parramatta L 61 25 1 2 - 12 - 84 - - - - - - - :
Rd13 SRow #11 Newcastle L 80 26 - - - 17 1 163 1 - 2 - - - - :
Rd14 SRow #11 Penrith L 80 34 - 2 - 12 - 83 2 - 1 - - - - :
Rd15 SRow #11 Wests-Tig L 80 32 - 2 - 13 - 115 - - 1 - - - - :
Rd17 SRow #11 Manly W 68 22 - 1 - 14 - 143 - - - - - - - :
Rd18 SRow #11 Nth Qld W 65 21 - - - 9 - 84 - - - - - - - :
Rd19 SRow #11 St Geo-Ill W 38 15 - - - 7 - 61 1 1 - - - - - :
Rd20 SRow #11 Cronulla L 51 17 1 2 - 7 1 61 - - - - - - - :
Rd21 Int #11 Melbourne L 48 14 - - - 12 - 105 1 1 1 - - - - :
Rd22 Int #15 Canterbury L 51 22 - - - 11 - 81 1 1 - - - - - :
Rd23 SRow #11 Brisbane W 80 26 - 1 - 17 2 170 - 4 1 - - - - :
Rd24 SRow #11 Warriors W 73 19 1 1 - 13 - 123 - - 2 1 - - - :
Rd25 SRow #11 Syd Rstrs W 78 22 - 2 - 12 - 96 2 - 1 - - - - :
MPSF SRow #11 Syd Rstrs L 80 32 - - - 11 - 107 1 2 1 1 - - - :
MSF SRow #11 Manly W 72 22 - 4 1 10 - 92 - - - 1 1 - - :
MF SRow #11 Canberra L 70 24 - 1 - 12 - 109 - - 1 1 - - - :
2019 TOTALS 1728 575 6 31 2 307 4 2758 13 15 15 5 2 - - :
2019 FG Average Minutes - 64.0
2019 FG Average Tackles (80 min) - 26.6
2019 FG Average Runs (80 min) - 14.2
2019 FG Average Meters per run - 9.0m
2019 FG Tackling Ability - 94.9%
Captaincy Record
Year  Grade   M(  W- D-L      %)
2011  FG      1
2012  FG      3
2013  FG     22
2014  FG     22
2015  FG      4(  1- 0-3    25%)
2016  FG      1(  0- 0-1     0%)
2017  FG      3(  2- 0-1    67%)

TOTAL        56(
Suspensions
Year       Grade  v  Wk CO  Ldg G CHARGE
none
Sin Bins
Year Grade      v  CHARGE
none
Player Awards
Year  Award
2002 - South Sydney Lower Grade Rising Star Award
2005 - South Sydney Supporters Choice Award
2008 - Coaches Award
2009 - George Piggins Medal (South Sydney First Grade Player of the Year)
2012 - George Piggins Medal (South Sydney First Grade Player of the Year)
2013 - George Piggins Medal (South Sydney First Grade Player of the Year)
2018 - RLPA 300 Club
2018 - Bob McCarthy South Sydney Clubman of the Year
2019 - South Sydney Burrow Appreciation Award
2019 - South Sydney DRLFC Life Membership
Representative Honours at South Sydney
Year Pos  Team                 Versus               Match         T  G/A  FG
2005      PM XIII              v PNG
2008      NSW City Origin      v NSW Country Origin NSW CvC
2009      NSW SOO (Induction Squad)
2009 5/8  NSW City Origin      v NSW Country Origin NSW CvC
Player News
© 2023 SSR Almanac / HOME / ABBREVIATIONS / RETURN